
For the first quarter of 2013, Michigan is still a leader in the housing recovery but a number of states have caught up, extending the housing recovery across the nation. Throughout the state we are seeing inventory shortages and rising values. Southeast Michigan remains the most active with the lowest inventory and strongest buyer demand. A new term is being used in the industry: the Shadow Demand. Like the Shadow Inventory which represented the potential bank-owned homes that could go on the market, the Shadow Demand represents the pent-up Buyers who have been holding back for the past 5 years. While the release of the shadow bank inventory has been slow and steady, the Shadow Demand seems to be jumping in all at once.
We expect a shortage of homes for sale throughout 2013 and 2014 with inventories rising and demand slowing down a bit in 2015 as interest rates increase and the Shadow Demand is dissipated. How quickly home inventories will raise depends on two factors: the pace of appreciation, and more importantly, how quickly Sellers realize that home values are improving. For many Sellers, values have risen enough that it makes sense to sell now, particularly if you are also buying.
For anyone who has purchased a home in the past four years, particularly investors, it is a great time to test the market. You should be pleasantly surprised on the potential return on your investment. The same holds for those who leased their homes, waiting for the values to rise.
Historically, with low For Sale inventories, home builders fill the gap. So far, local home builders, which traditionally make up the majority of new construction, have had difficulty obtaining financing so they have not been able to supply any inventory relief.
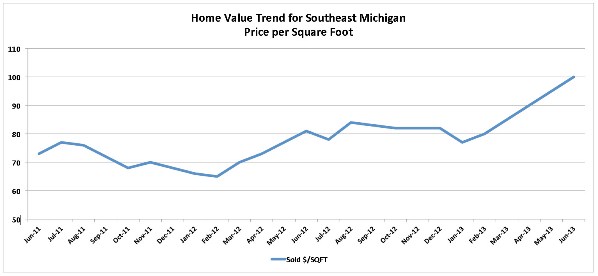
Following the market trends over the past three years, you can see values have been moving off the bottom since the spring of 2011 and gaining speed these last three quarters.
Charts: Average Cost per Square Feet
 The
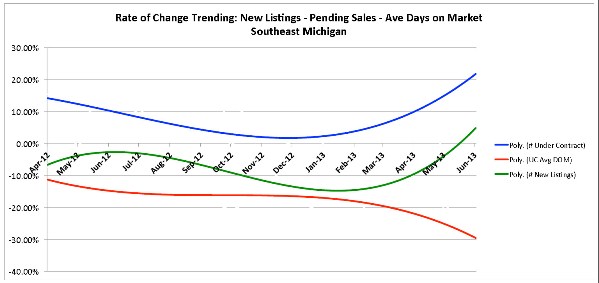
next two charts show both the decline in the number of new home listings
entering the market as well as the increase in the number of homes being placed
under contract. It is interesting to note the declining bank-owned share of the
market.
The
next two charts show both the decline in the number of new home listings
entering the market as well as the increase in the number of homes being placed
under contract. It is interesting to note the declining bank-owned share of the
market.Charts: Home Listings Entering the Market & Home Listings Placed Under Contract
 The
result is a big increase in Sales Absorption, which is the percent of the
available homes being sold each quarter. Considering that about a third of homes
for sale are not really saleable because of condition, motivation or price, a
44% rate this past quarter represents a true absorption of closer to 70%, which
is the driving force behind the double digit appreciation rates.
The
result is a big increase in Sales Absorption, which is the percent of the
available homes being sold each quarter. Considering that about a third of homes
for sale are not really saleable because of condition, motivation or price, a
44% rate this past quarter represents a true absorption of closer to 70%, which
is the driving force behind the double digit appreciation rates.Chart: Sales Absorption
 As a
company we continue to gain a bigger piece of the pie, and most importantly, we
are gaining market share in the number of new listings taken. We are working
hard to reach out to you, our clients, and show you the opportunities in this
market.
As a
company we continue to gain a bigger piece of the pie, and most importantly, we
are gaining market share in the number of new listings taken. We are working
hard to reach out to you, our clients, and show you the opportunities in this
market. It is important to note in this improving market that a decline in the number of sales reflects the shortage of inventory, not a market slowdown.
If you would like more information on the market, like to list your property, or want information on any property with any broker, you may call or email at anytime.
Thank You,
Norm Werner
Put my team to work for you
P: 248-763-2497
normwerner@comcast.net
www.themilfordteam.com
www.movetomilford.com


No comments:
Post a Comment